Workshop Exercise 4.1 - Dashboard Design
Table of Contents
- Objective
- Step 1 - Creating a New Dashboard
- Step 2 - Up-Down Panels
- Step 3 - Time Series Data
- Step 4 - Collaborate With Your Team
Objective
- Begin building the system dashboard
- Encourage collaboration with team
Step 1 - Creating a New Dashboard
With our stack ready to go, we can now start building a dashboard to display metrics about our system.
In the Grafana webUI, click on Dashboards and then the + Create Dashboard button in the middle of the screen.
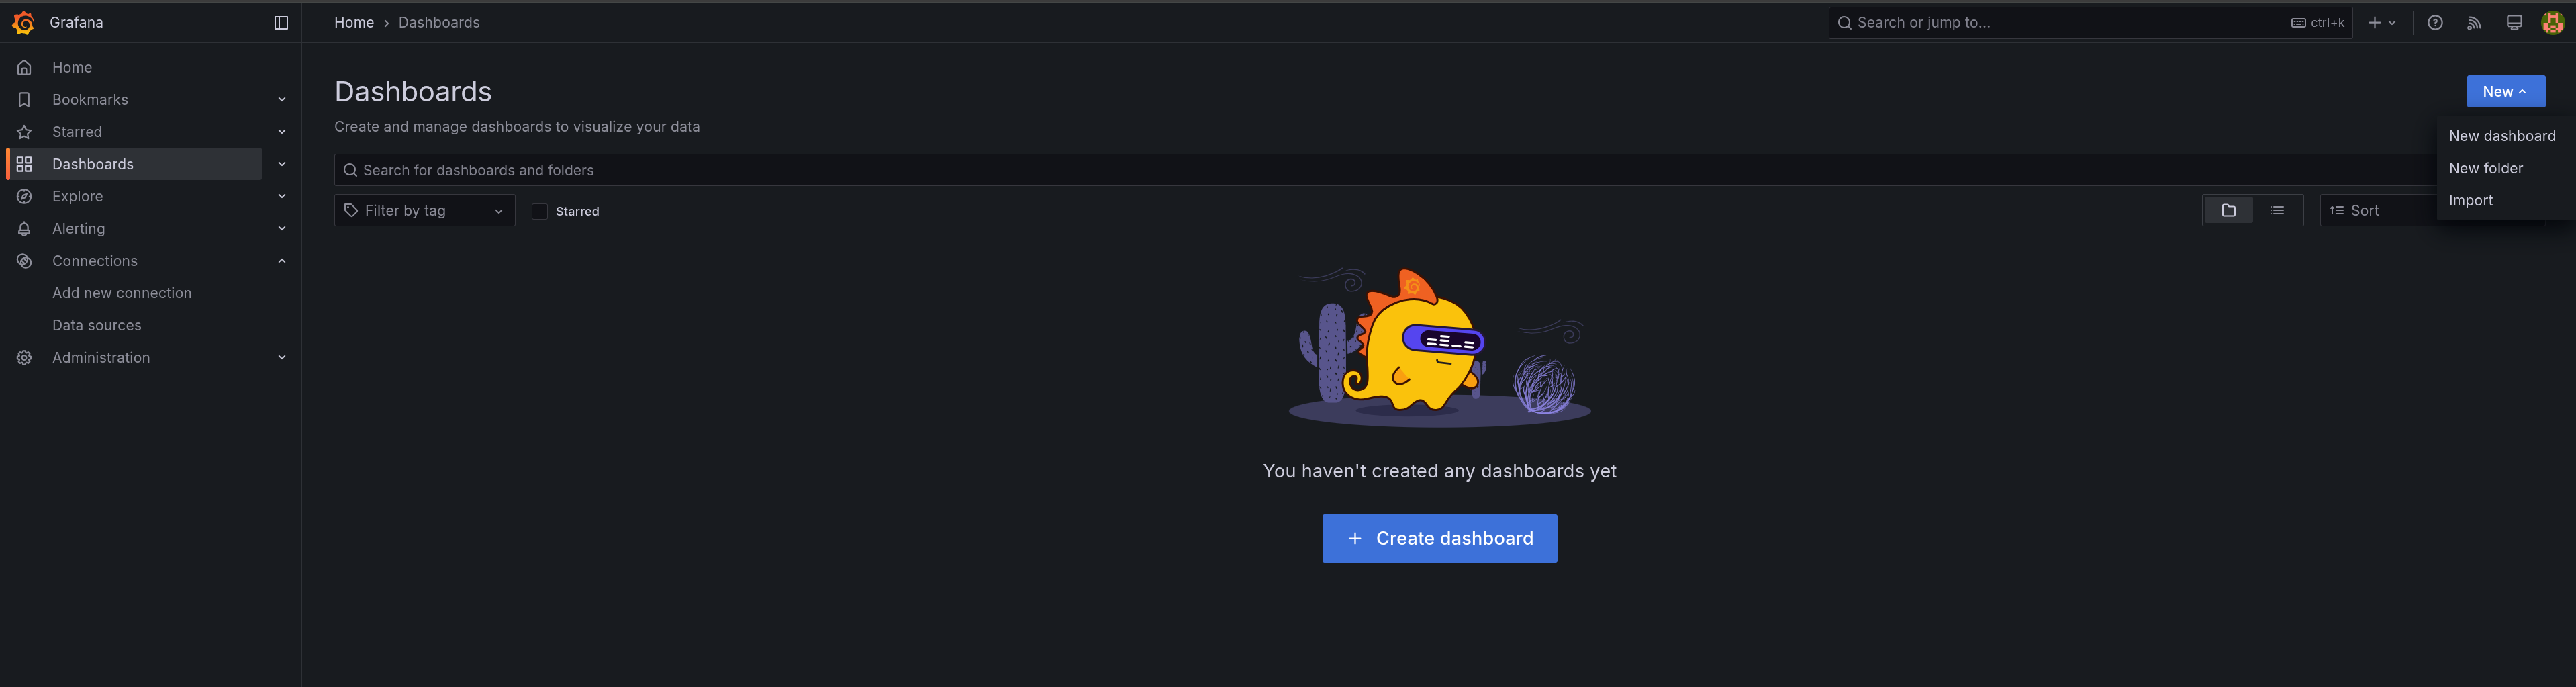
This will create a new dashboard.
Step 2 - Up-Down Panels
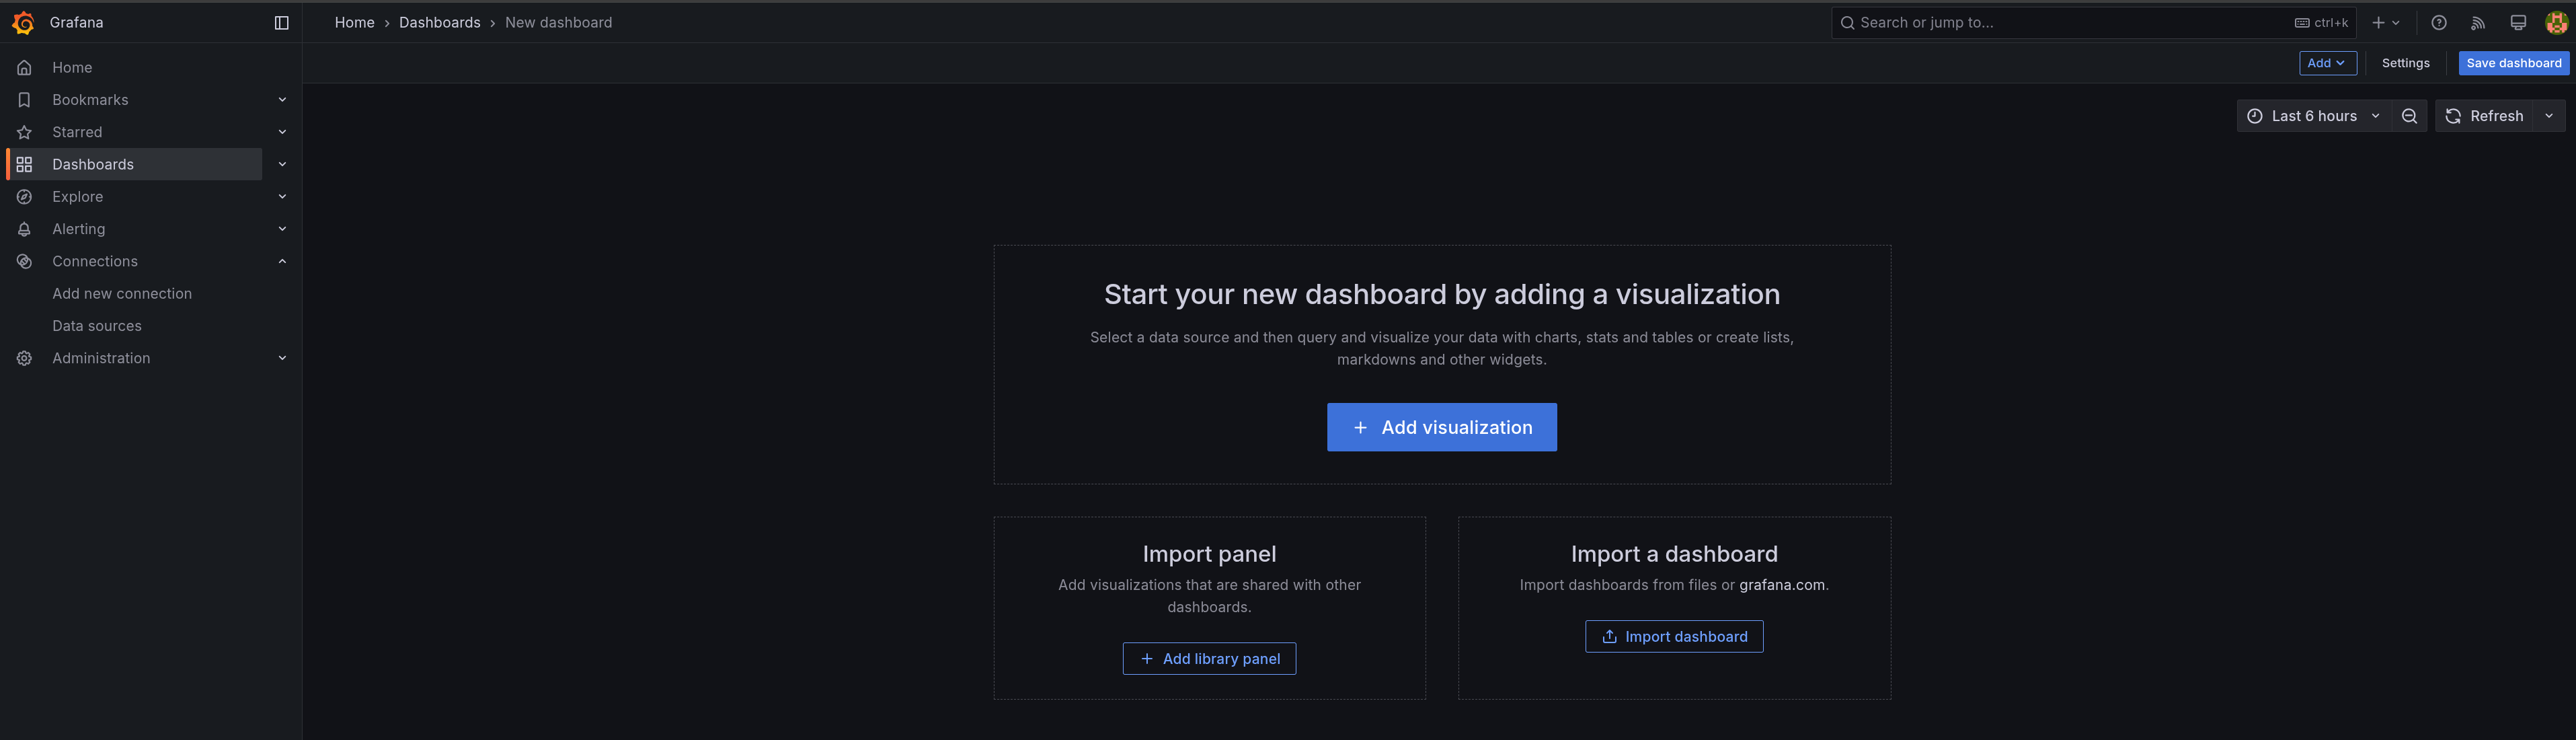
On the new dashbaord, select the + Add Visualization button to begin building a panel for the dashboard.
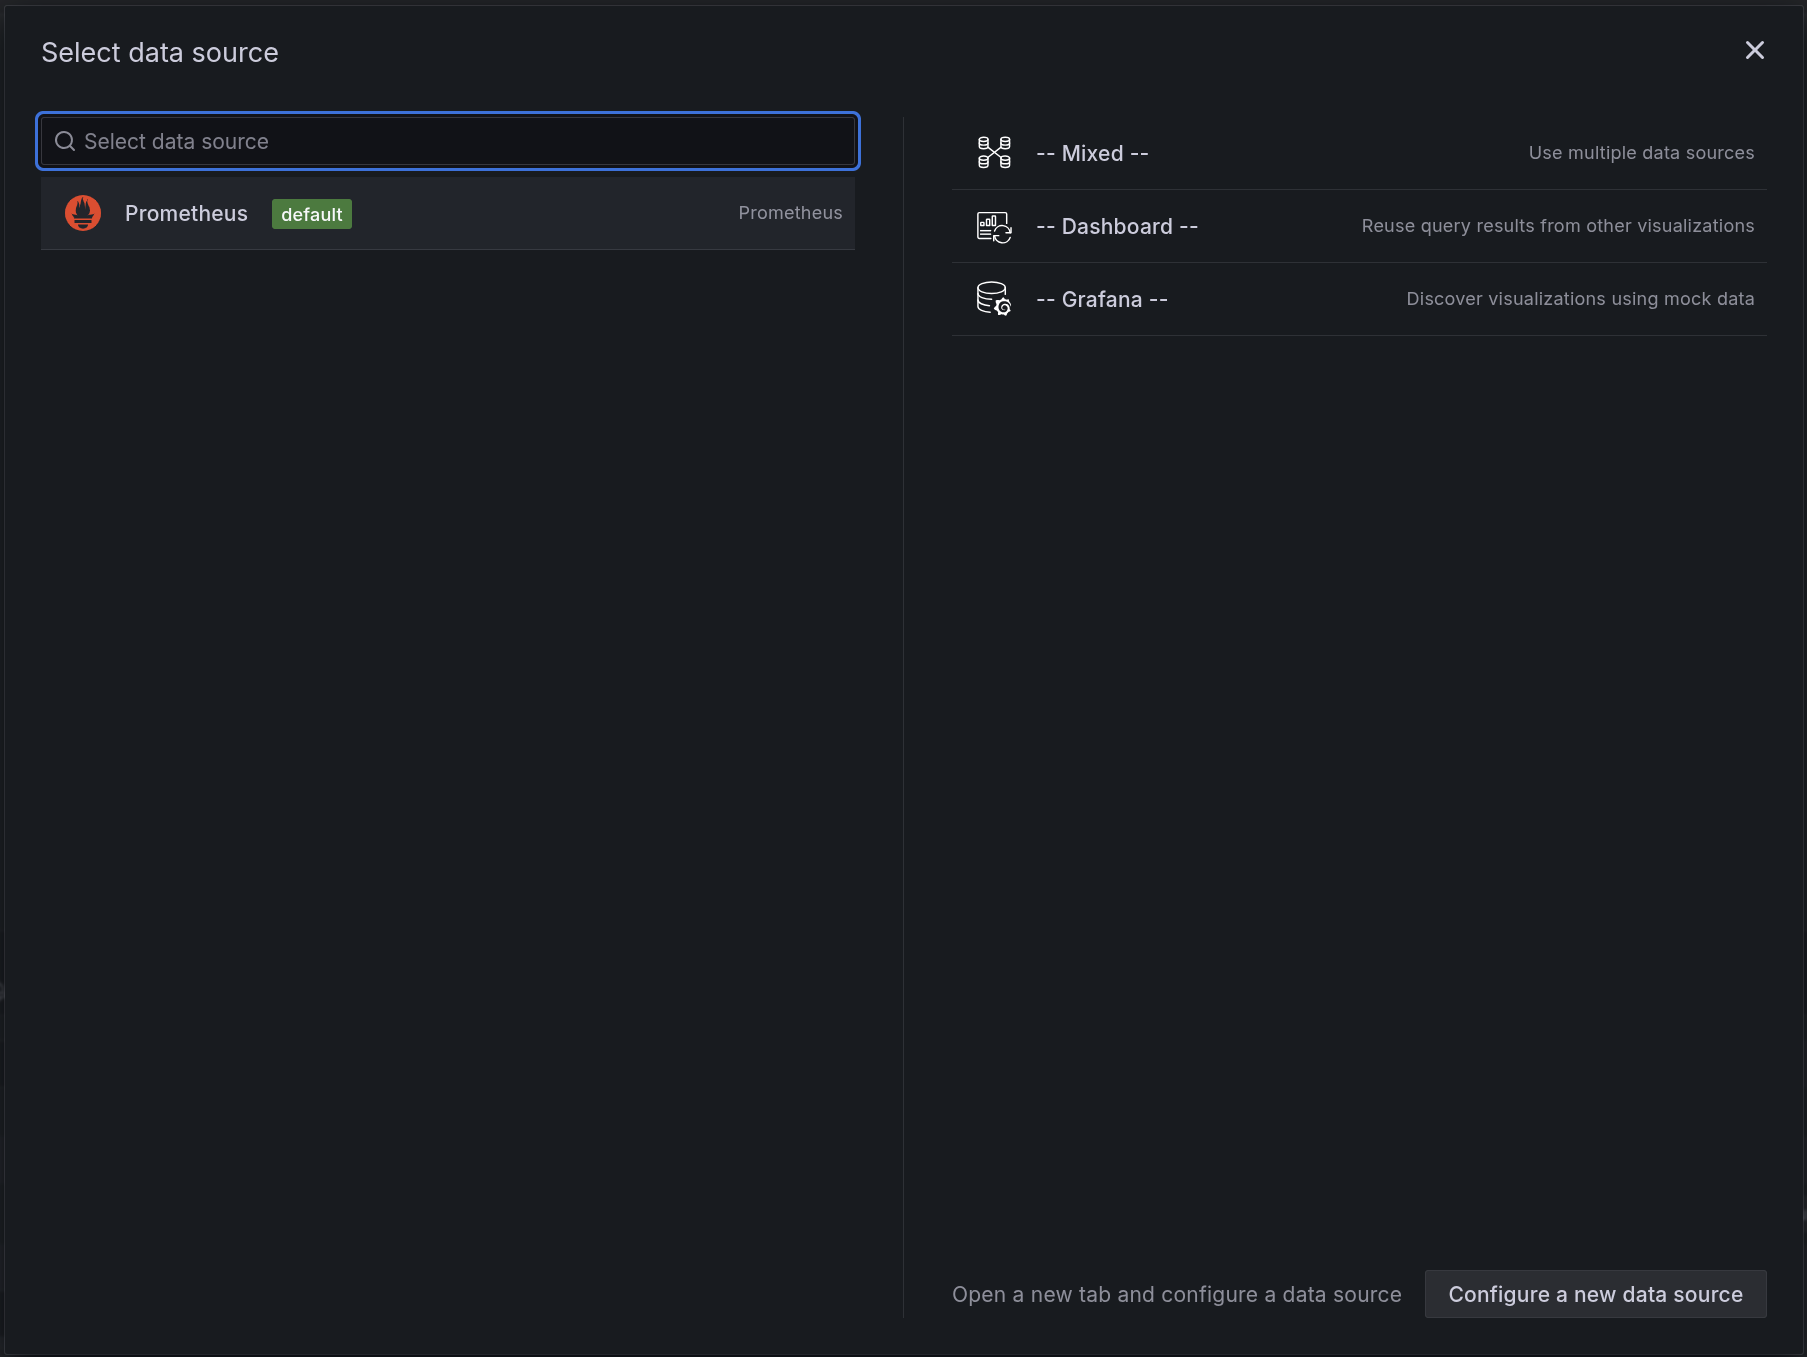
In the pop-up window, select Prometheus as the primary data source for the dashboard.
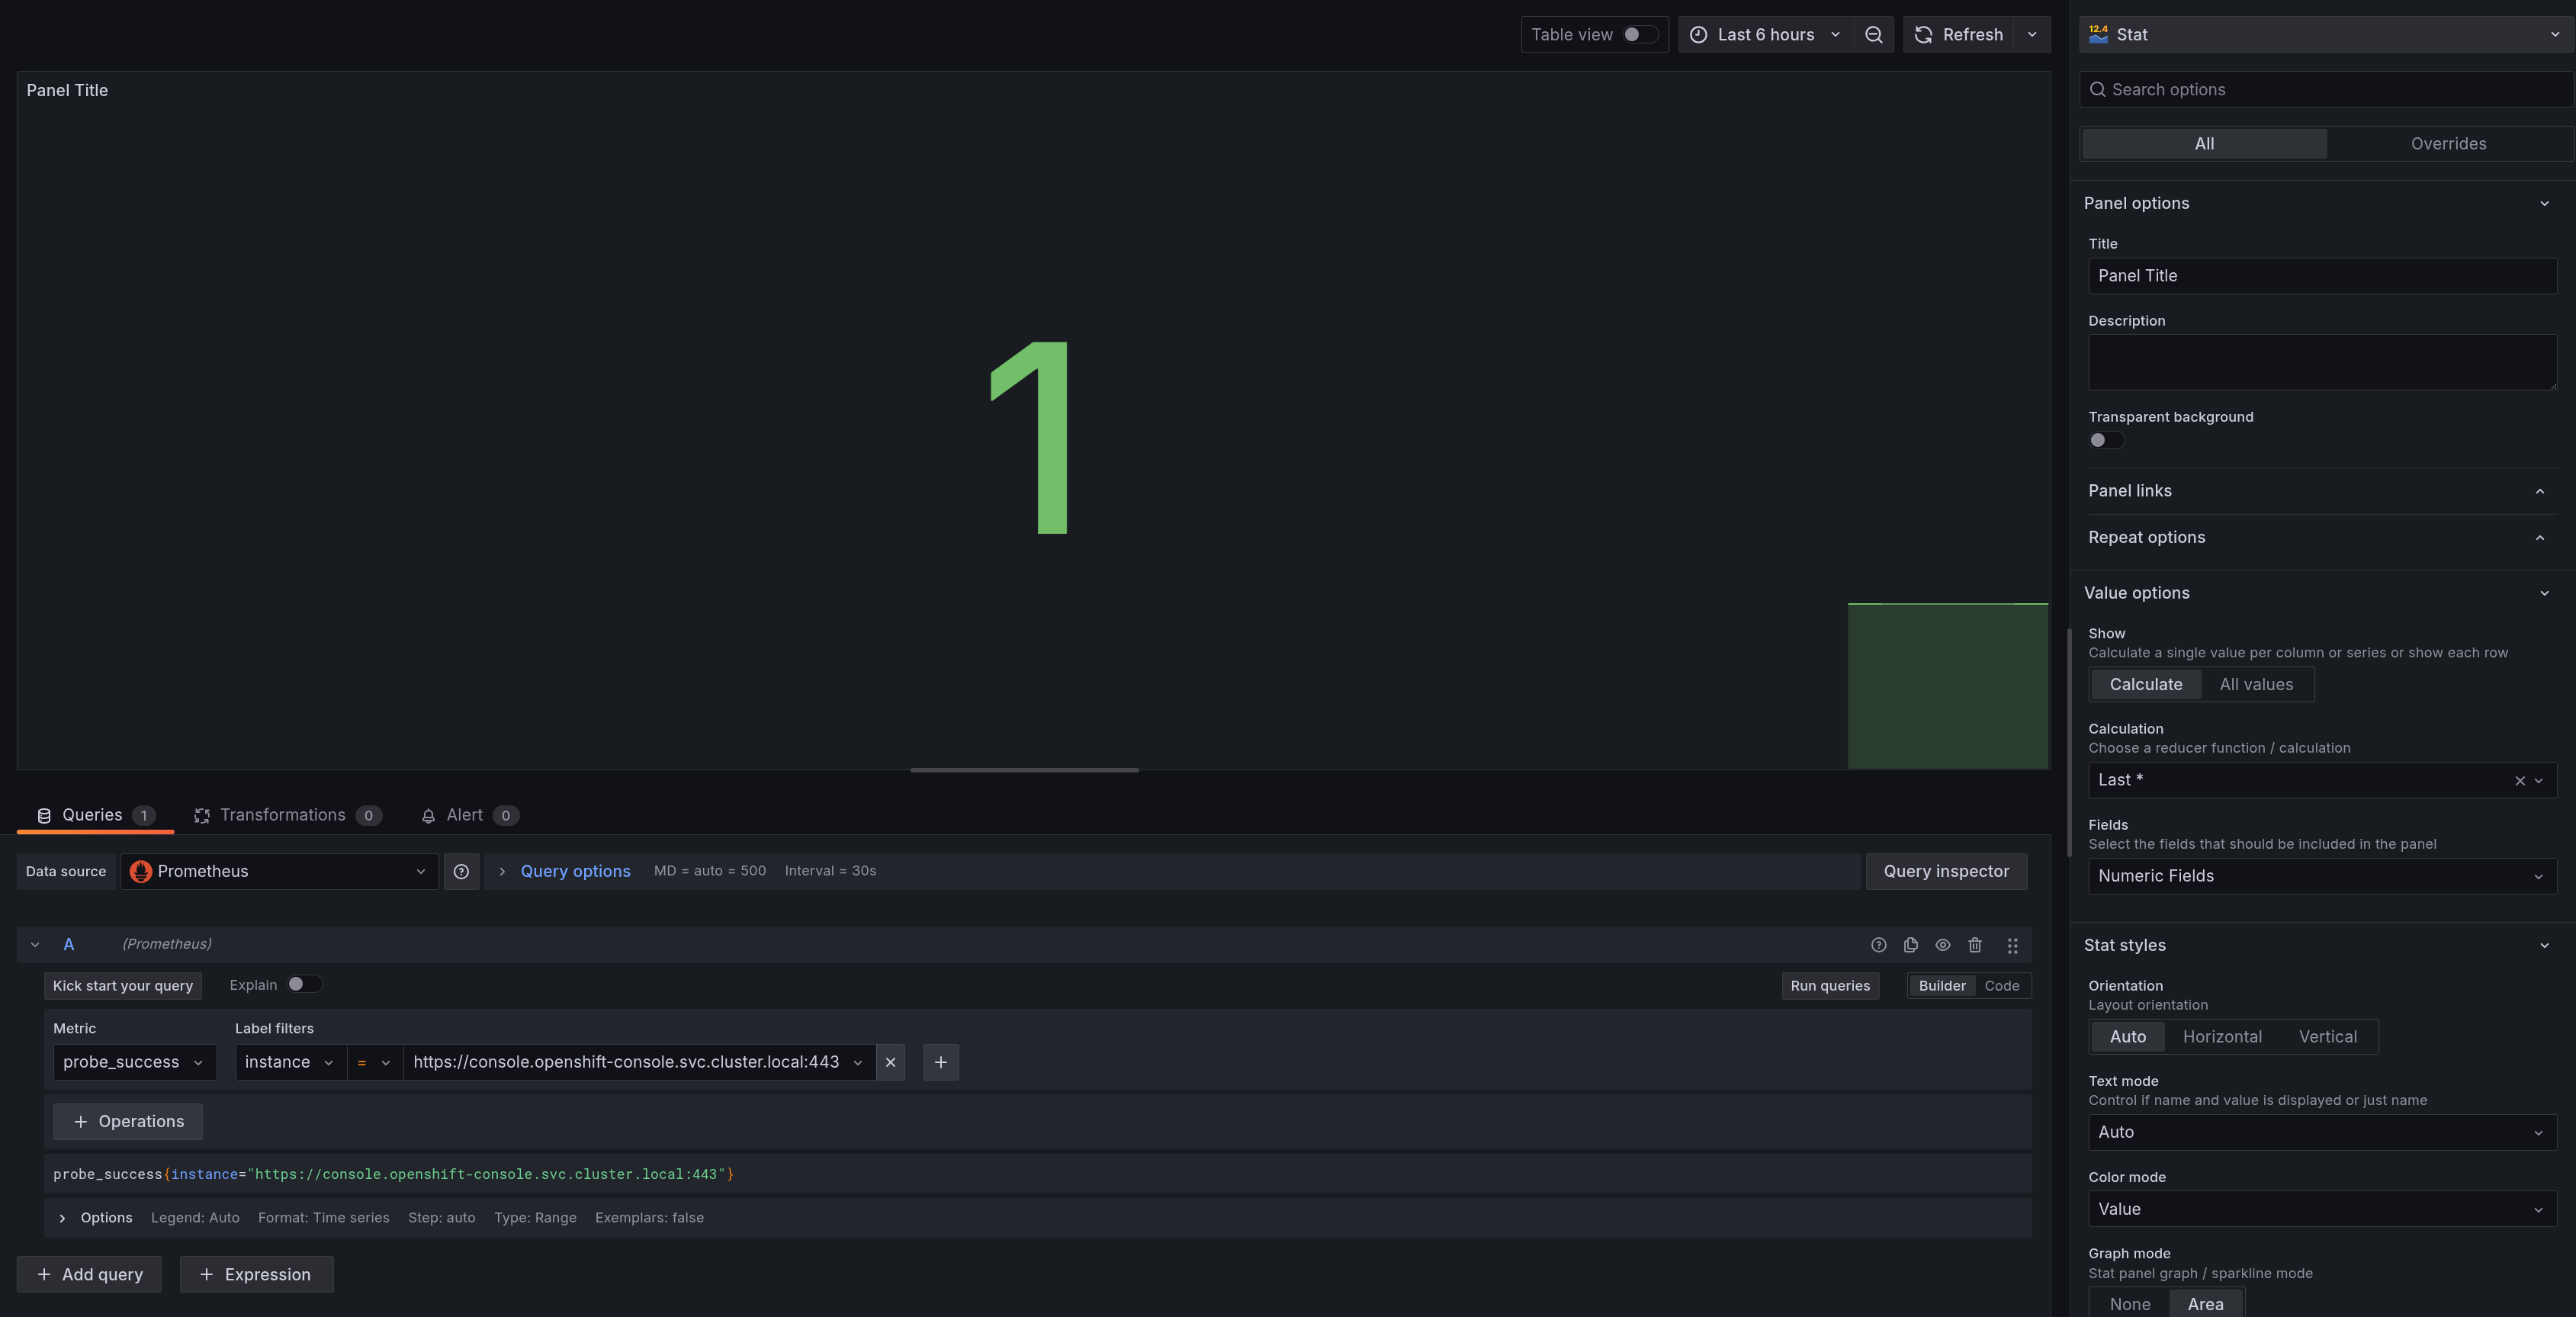
A common panel for dashboard is a simple Up/Down panel, which is built off the probe_success metric.
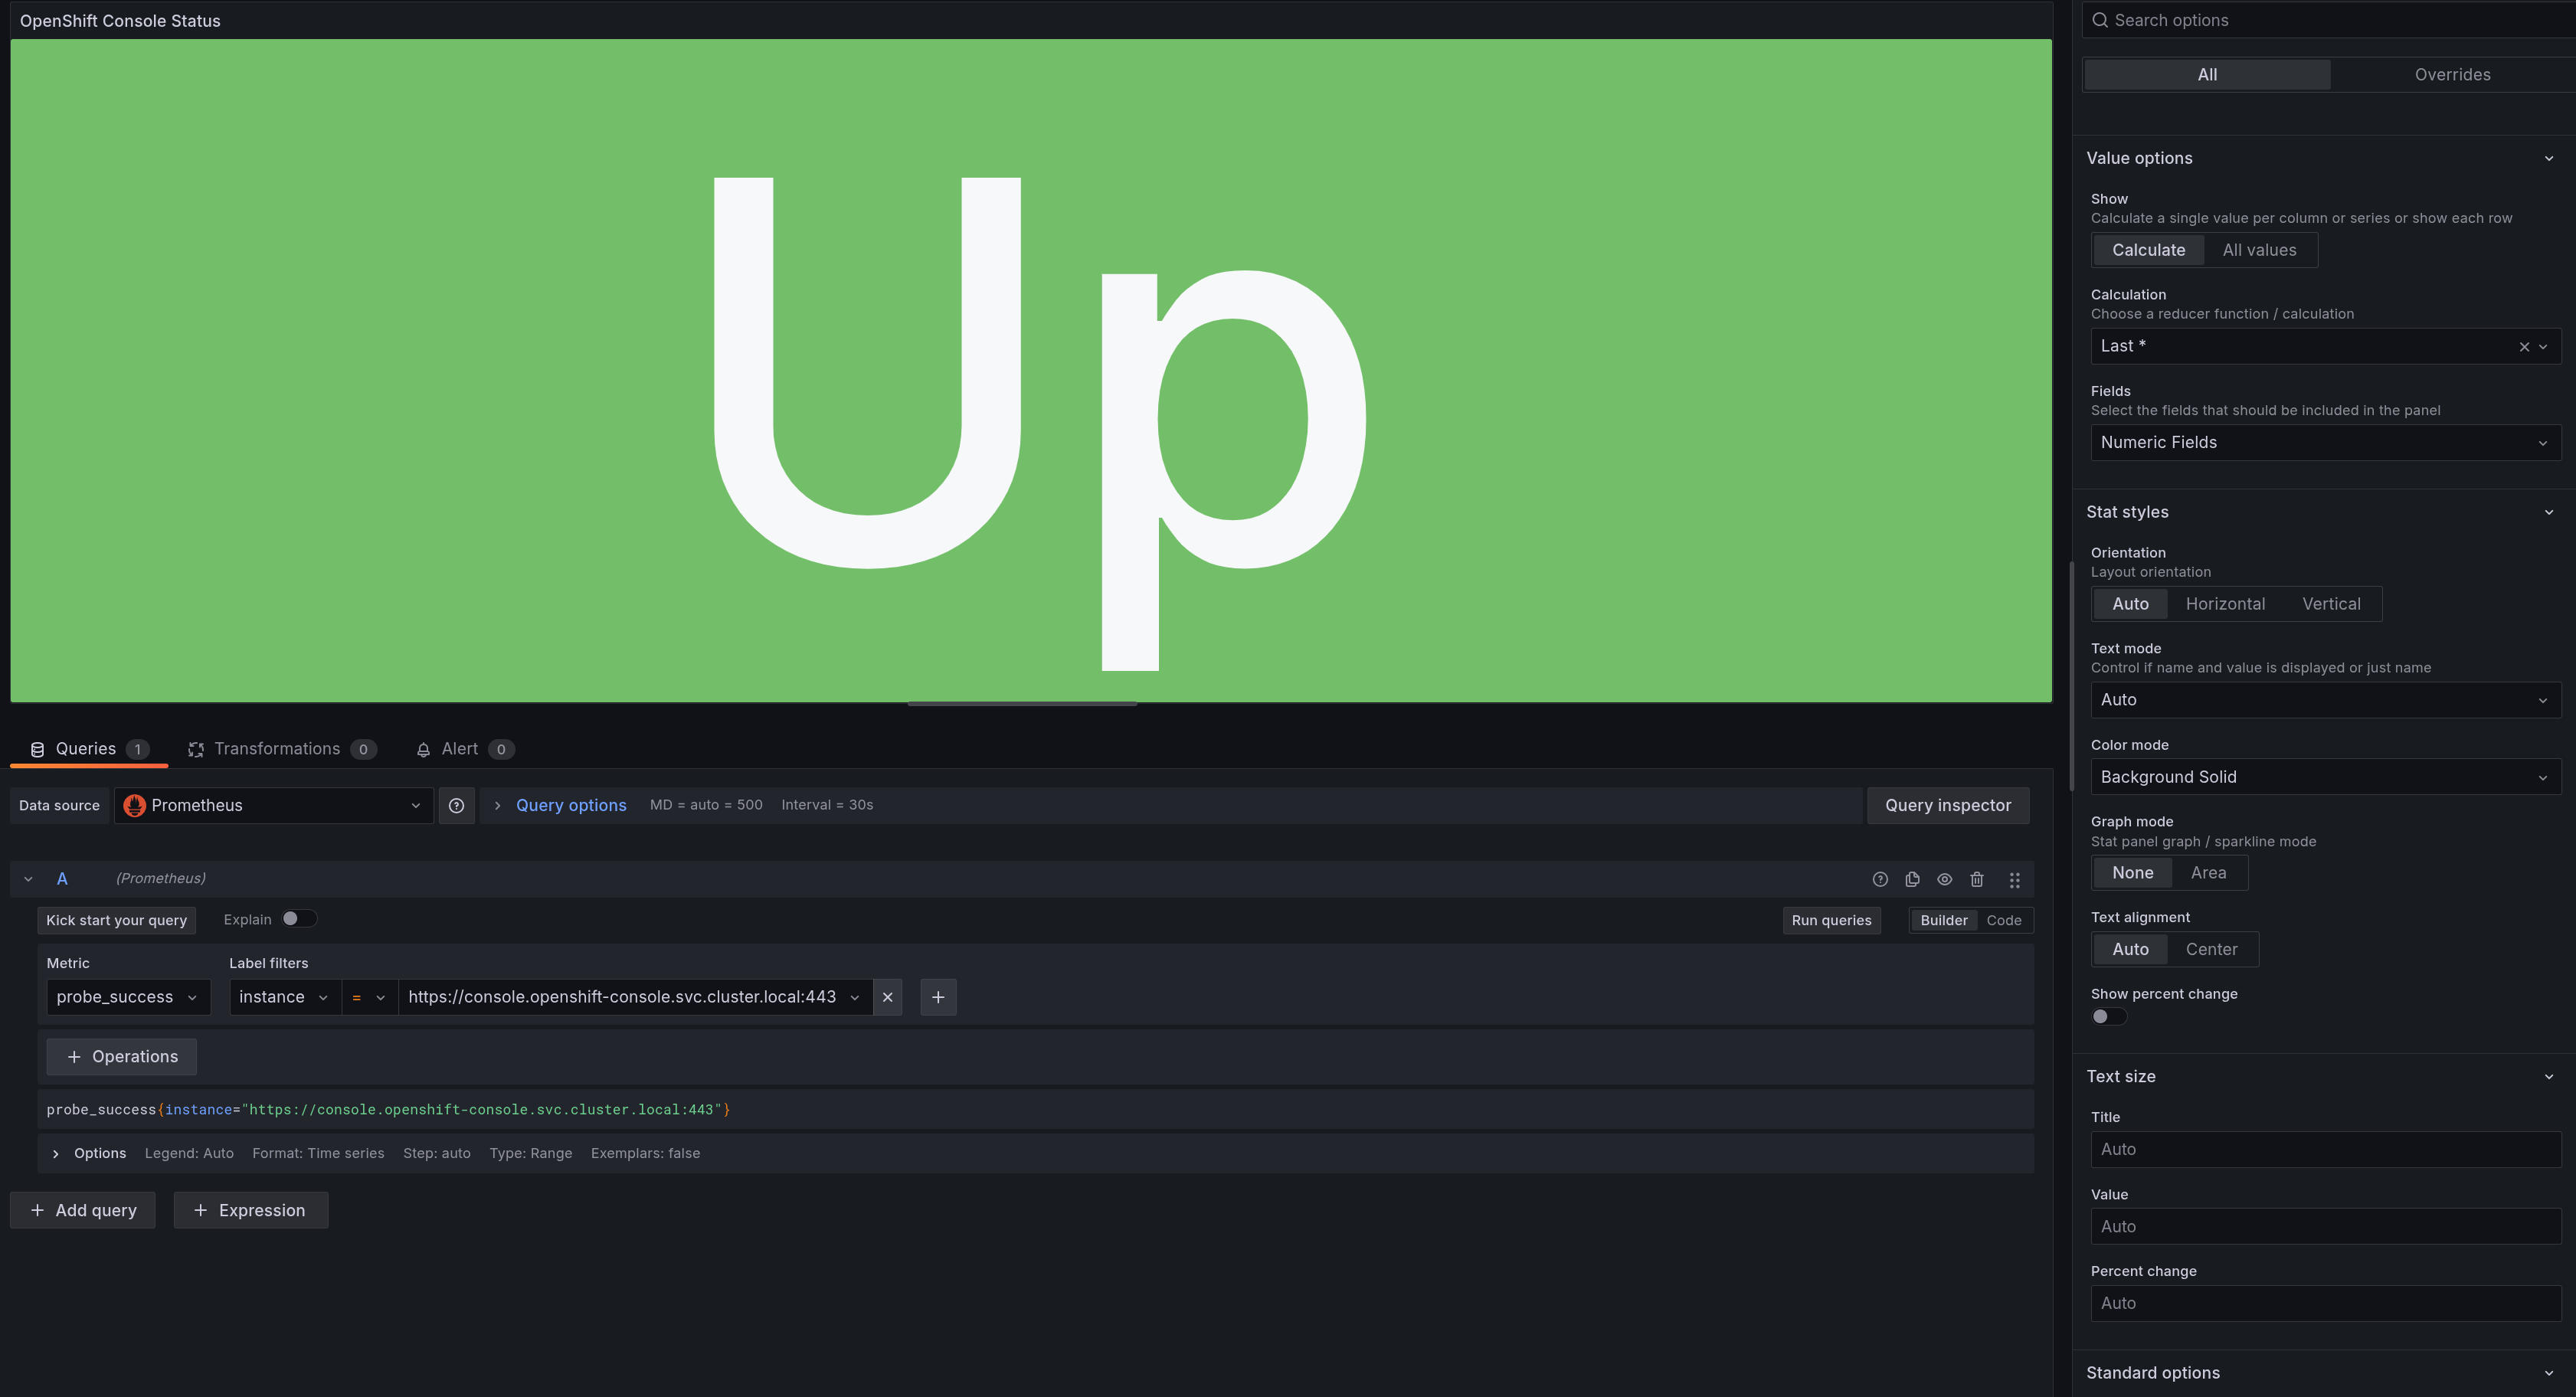
In the top right corner, change the panel type to Stat, then fill in the first query with:
probe_success{instance="https://console.openshift-console.svc.cluster.local:443"}
Remember - Prometheus metrics are key:value pairs with tags, so to find the metrics for a specific instance, such as the OpenShift web console, add a filter with the key:value pair of instance:https://console-openshift-console.svc.cluster.local:443
Hit rhe Run Queries button to see the latest value for your query:
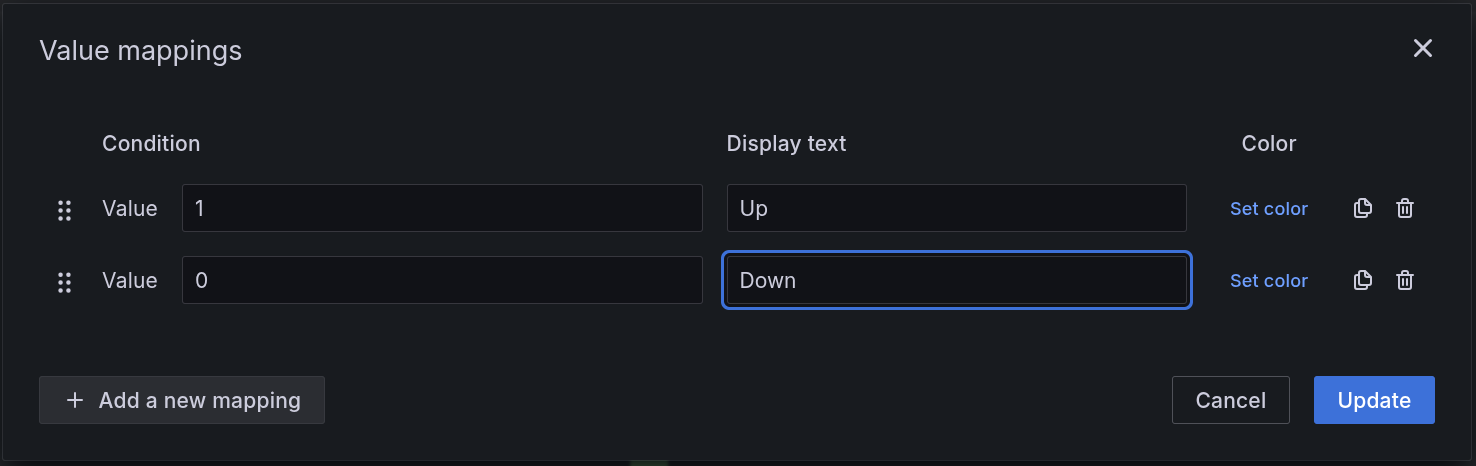
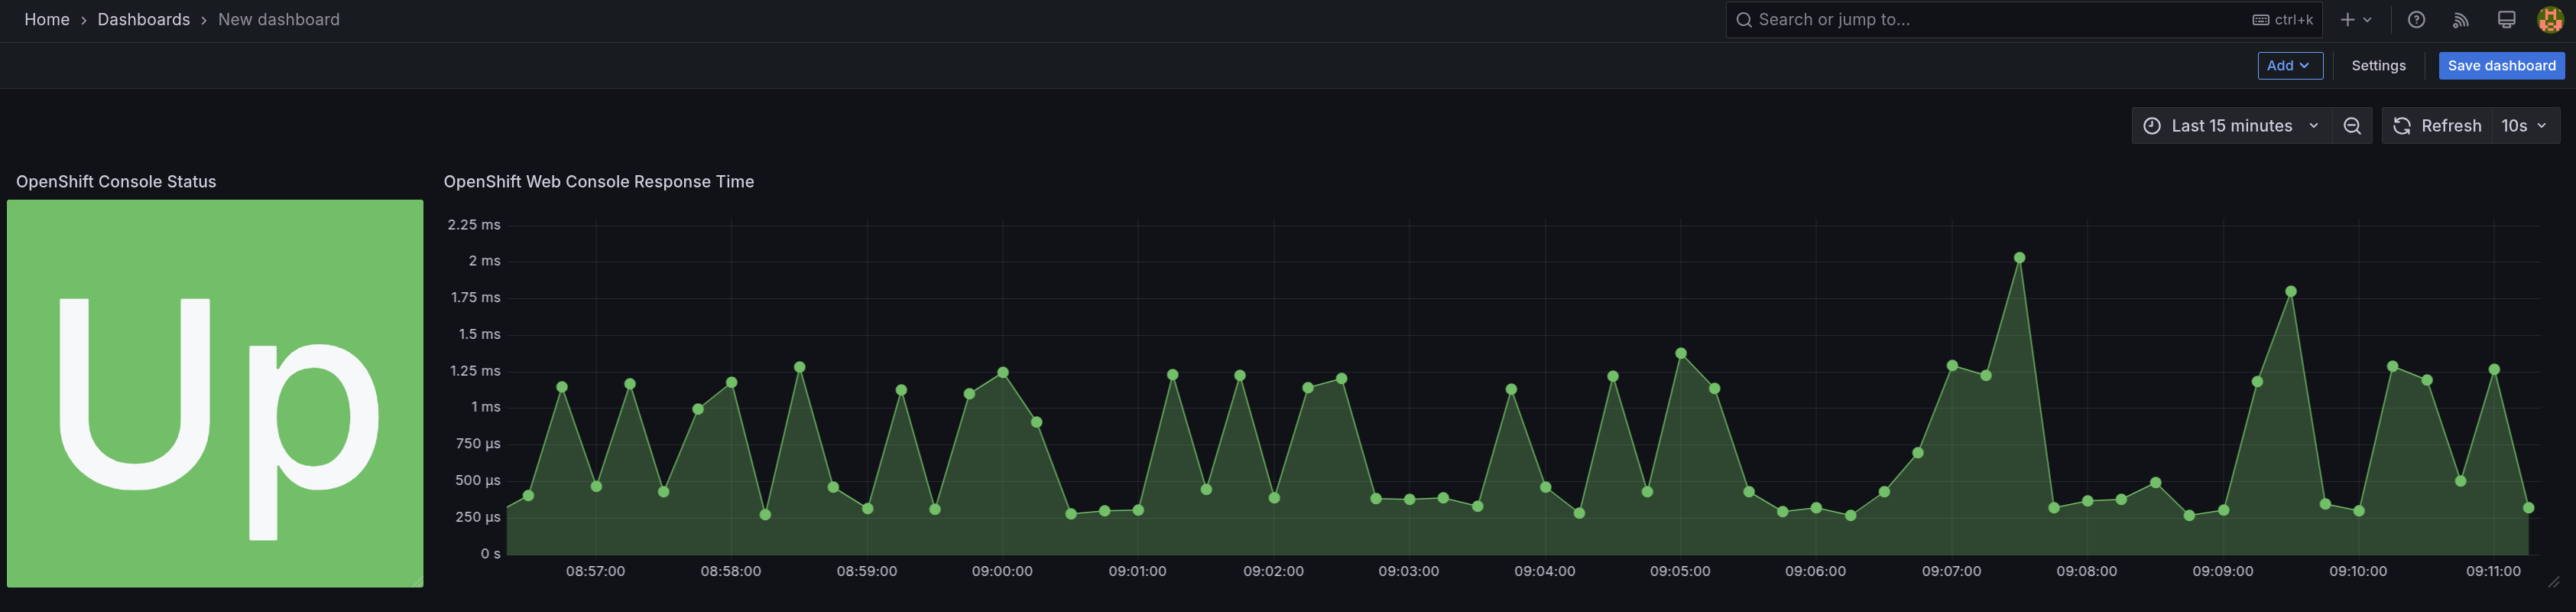
Now, we can map our values to ‘Up’ and ‘Down’ using a value mapping. In the right-hand menu, scroll down to the Value mappings section and edit the value mappings:
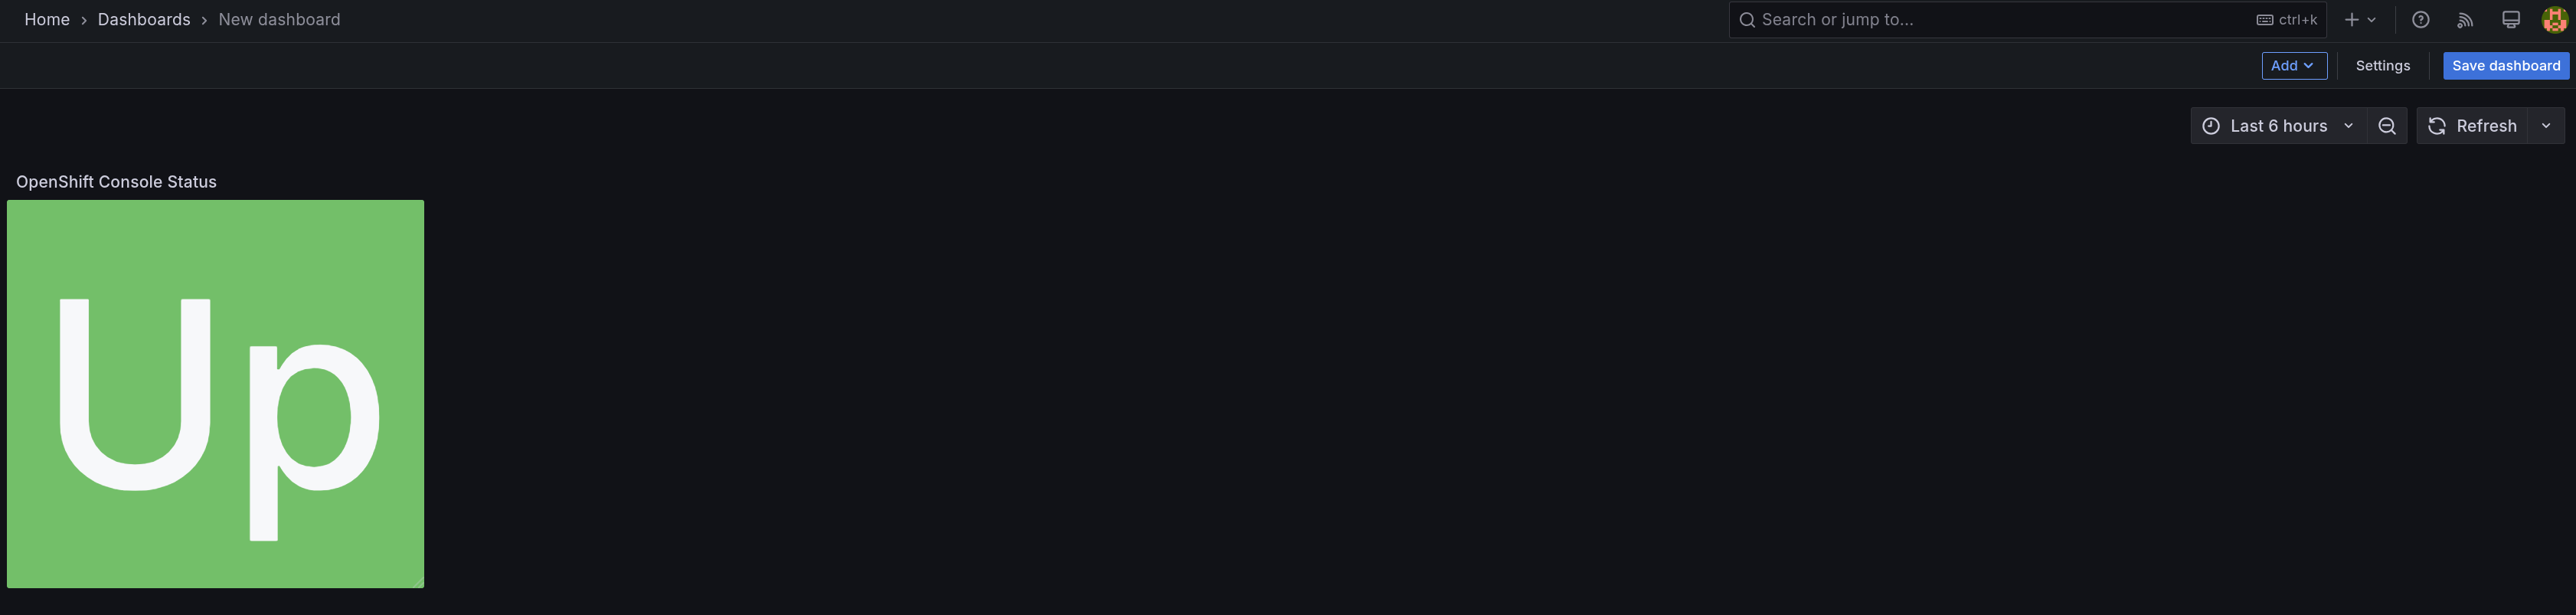
Feel free to play around with other options in the right-hand menu until the panel has a look/feel you like. Here’s an example:
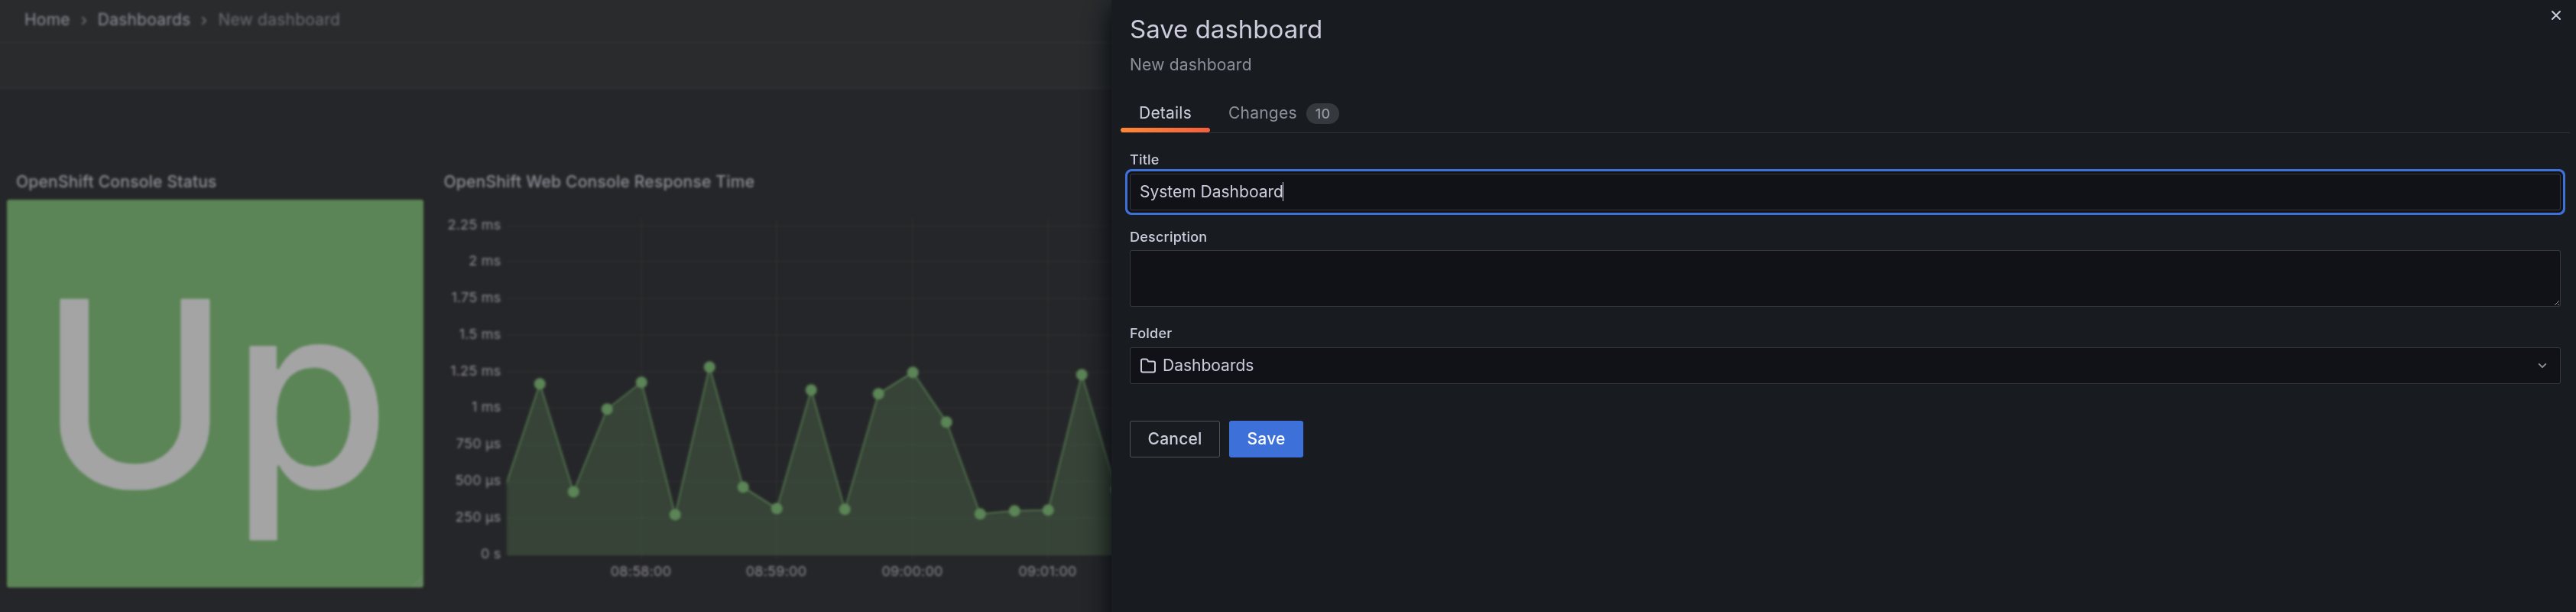
When finished, select the Back to Dashboard button at the top right. Resize your panel as you’d like, then save your dashboard with the Save dashboard button.
Step 3 - Time Series Data
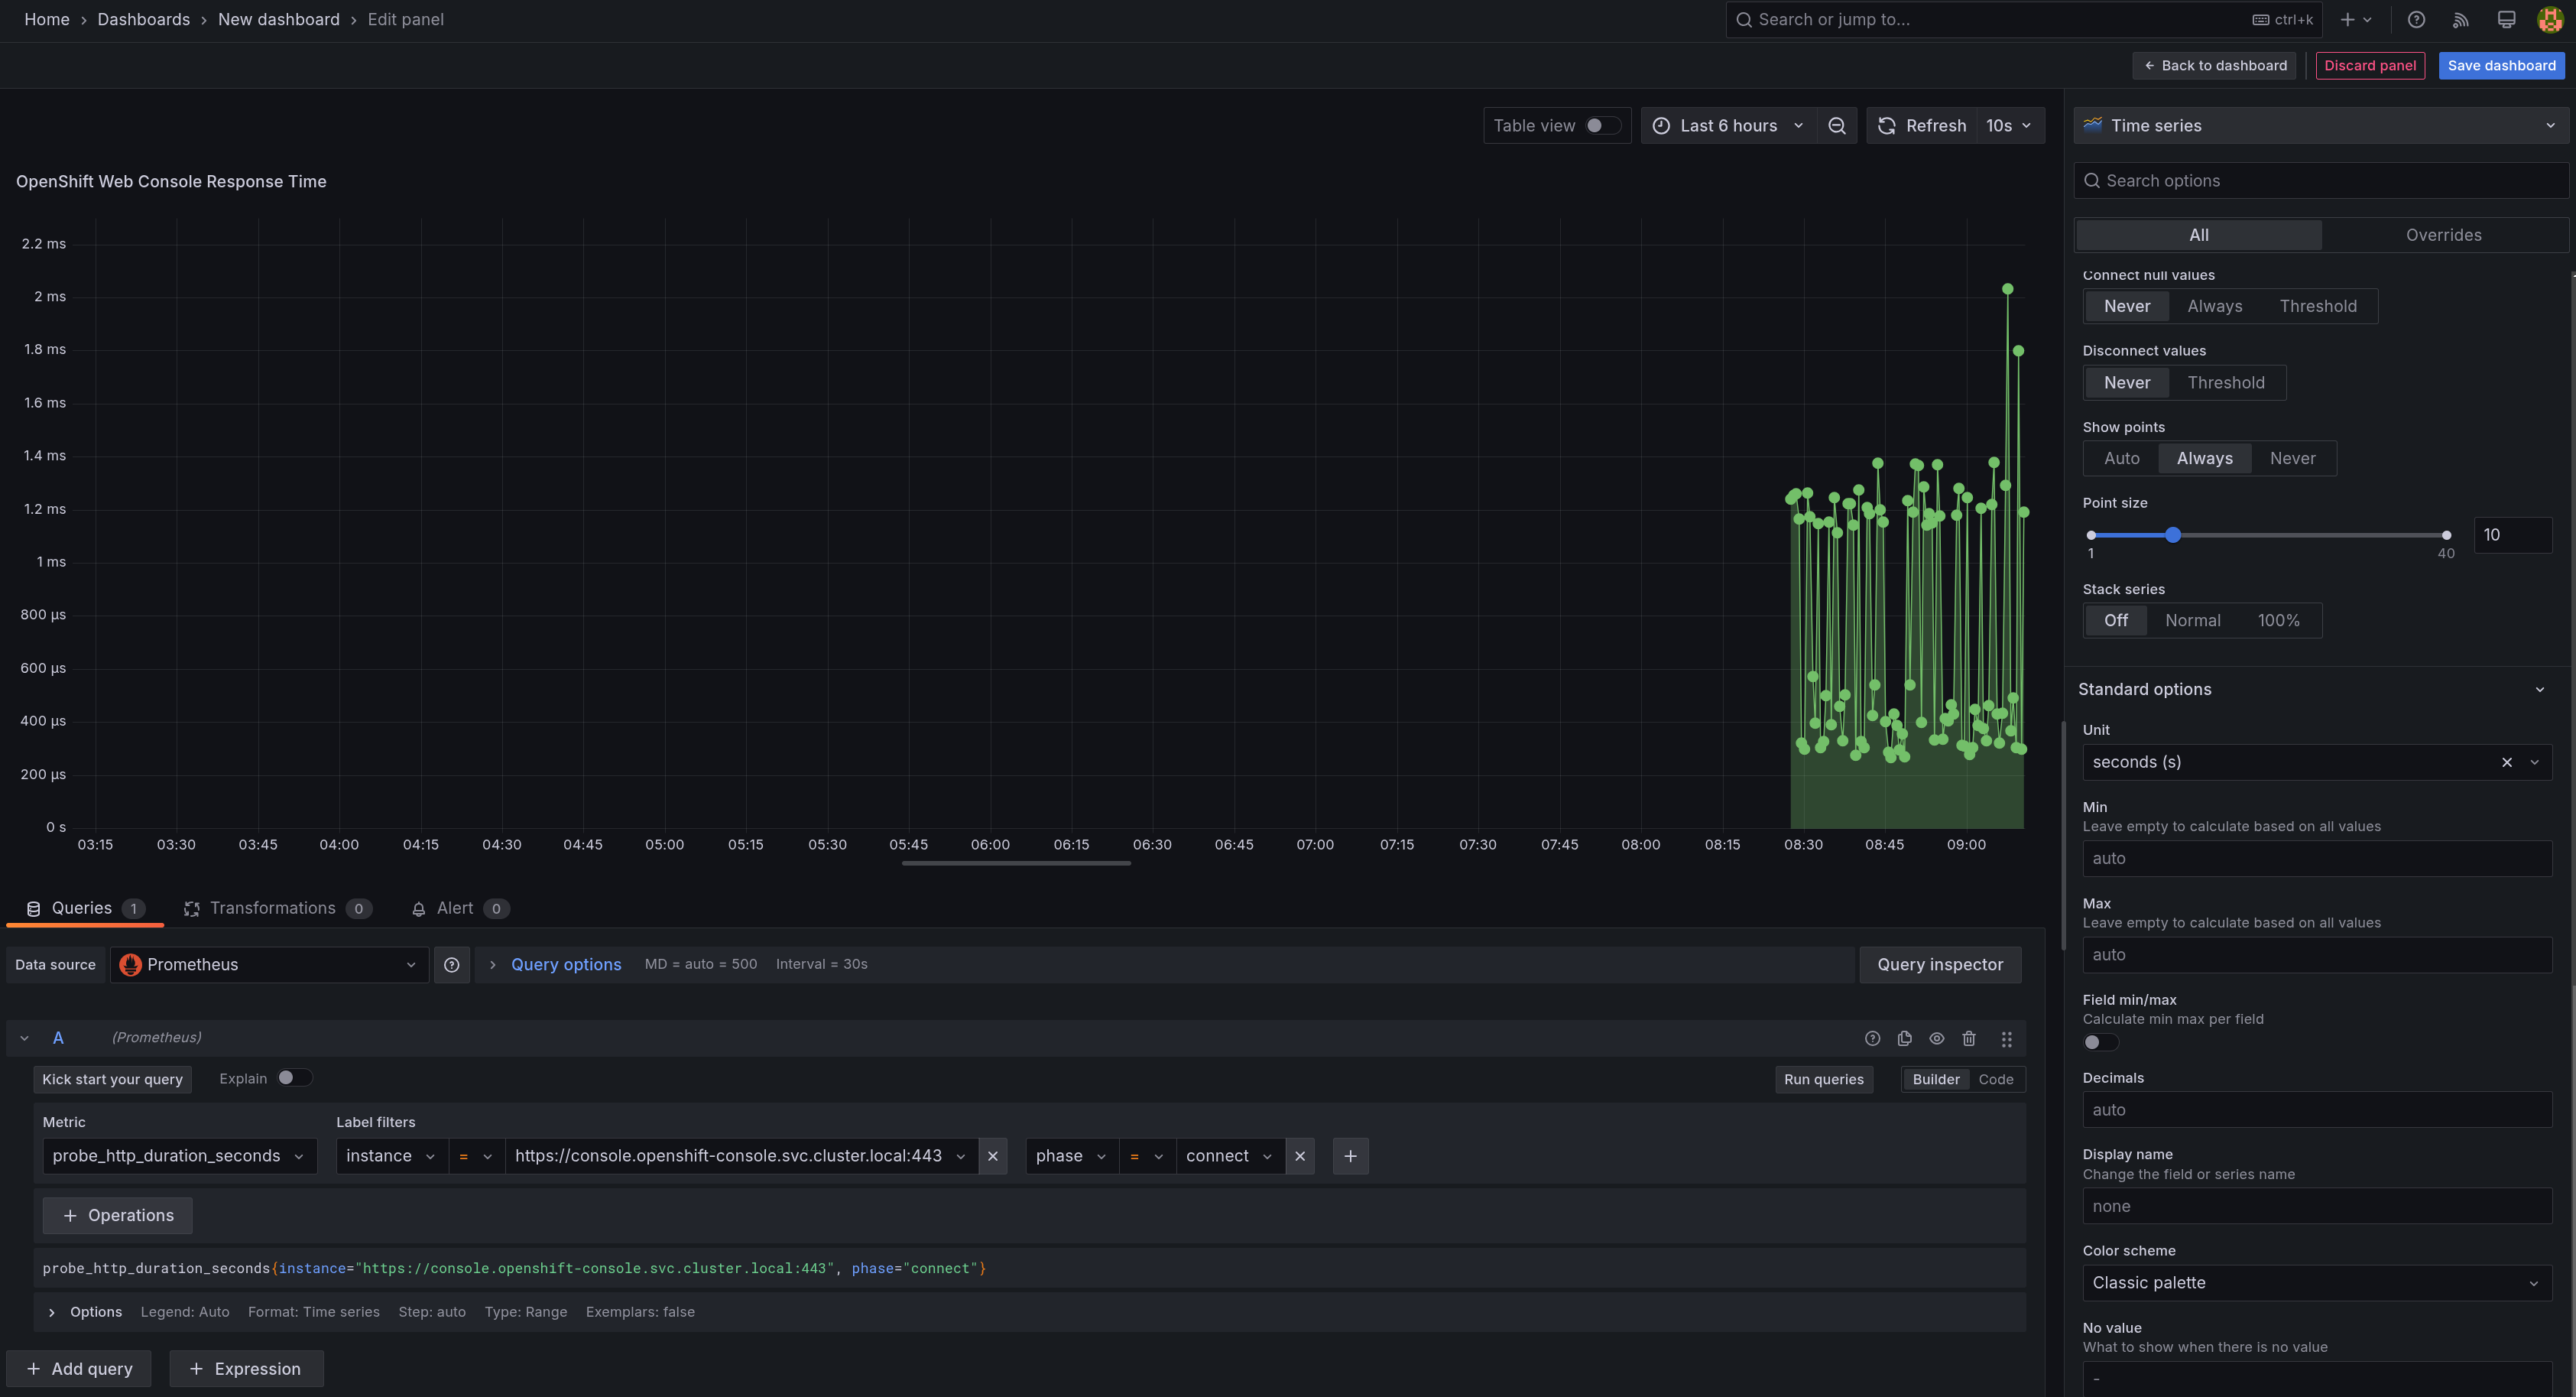
Another common panel on a dashboard is displaying time-series data, such as response times. Add a new panel of type Time series, with the following query:
probe_http_duration_seconds{instance="https://console.openshift-console.svc.cluster.local:443", phase="connect"}
Feel free to modify options in the right hand panel, however it is recommended to set the unit to Time (seconds).
For example:
Once complete, return to the dashboard, resize the panel to your liking, and save your dashboard.
Step 4 - Collaborate with your Team
Continue to build out the dashboard according to you and your team’s preferences. There is no set right or wrong here - feel free to experiment and modify as you’d like.
The Kick start your query fuction in grafana can help you discover metrics and get them displayed on a panel.
Once done editing, ensure you save your dashboard.
Navigation
| Previous Exercise | Next Exercise |